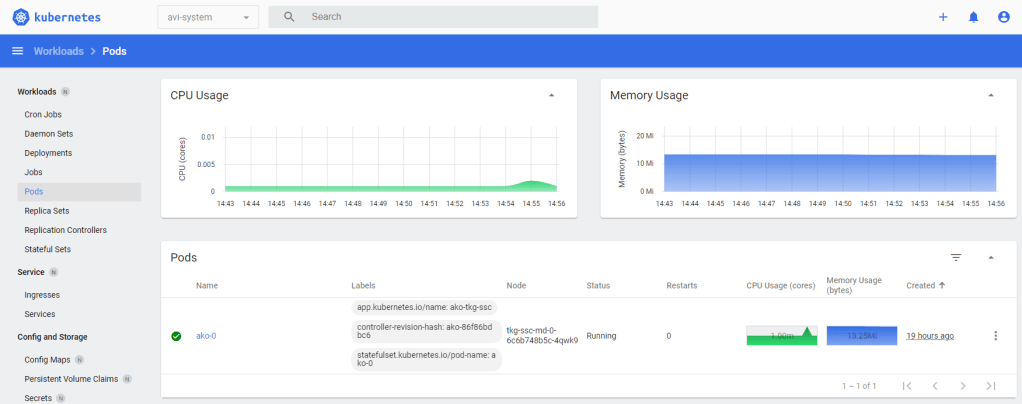
Dashboard is a web-based Kubernetes user interface. You can use Dashboard to deploy containerized applications to a Kubernetes cluster, troubleshoot your containerized application, and manage the cluster resources. You can use Dashboard to get an overview of applications running on your cluster, as well as for creating or modifying individual Kubernetes resources (such as Deployments, Jobs, DaemonSets, etc). For example, you can scale a Deployment, initiate a rolling update, restart a pod or deploy new applications using a deploy wizard.
Dashboard also provides information on the state of Kubernetes resources in your cluster and on any errors that may have occurred.

Deploy Kubernetes Dashboard
kubectl apply -f https://raw.githubusercontent.com/kubernetes/dashboard/v2.2.0/aio/deploy/recommended.yamlTo get full cluster access to the kubernetes-dashboard account run the following
kubectl create clusterrolebinding add-on-cluster-admin --clusterrole=cluster-admin --serviceaccount=kubernetes-dashboard:kubernetes-dashboardExpose the dashboard using the ingress service so it can be accessed externally, I’m using NSX Advanced Load Balancer (Avi) in my lab.
kubectl expose deployment -n kubernetes-dashboard kubernetes-dashboard --type=LoadBalancer --name=kubernetes-dashboard-public
This will then expose the kubernetes-dashboard deployment over port 8443 using the AKO ingress config for that TKG cluster.
Get the service details using this command
kubectl get -n kubernetes-dashboard svc kubernetes-dashboard-publicYou should see the following output:
root@photon-manager [ ~/.local/share/tanzu-cli ]# kubectl get -n kubernetes-dashboard svc kubernetes-dashboard-public
NAME                          TYPE           CLUSTER-IP      EXTERNAL-IP   PORT(S)          AGE
kubernetes-dashboard-public   LoadBalancer   100.71.203.41   172.16.4.34   8443:32360/TCP   17h
root@photon-manager [ ~/.local/share/tanzu-cli ]#
You can see that the service is exposed on an IP address of 172.16.4.34, with a port of 8443.
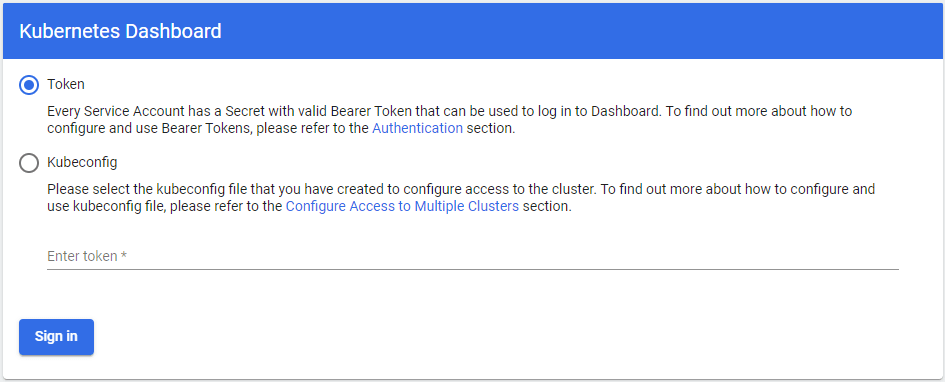
Open up a web browser and enter that IP and port. You’ll see a screen similar to the following.

You’ll need a token to login, to obtain a token use the following command.
kubectl describe -n kubernetes-dashboard secret kubernetes-dashboard-tokenCopy just the token and paste it into the browser to login. Enjoy Kubernetes Dashboard. Enjoy!

$
kubectl describe -n kubernetes-dashboard secret kubernetes-dashboard-tokenError from server (NotFound): secrets “kubernetes-dashboard-token” not found
Please follow this guide
https://github.com/kubernetes/dashboard/blob/master/docs/user/access-control/creating-sample-user.md
Already found this manual, thank you!