Expose Kubernetes Dashboard with Contour

Dashboard is a web-based Kubernetes user interface. You can use Dashboard to deploy containerized applications to a Kubernetes cluster, troubleshoot your containerized application, and manage the cluster resources. You can use Dashboard to get an overview of applications running on your cluster, as well as for creating or modifying individual Kubernetes resources (such as Deployments, Jobs, DaemonSets, etc). For example, you can scale a Deployment, initiate a rolling update, restart a pod or deploy new applications using a deploy wizard.

Dashboard also provides information on the state of Kubernetes resources in your cluster and on any errors that may have occurred.

In the previous posts, I’ve described how to deploy Kubernetes Dashboard with TLS certs and expose using a Load Balancer service.

This post shows you how you can expose the Dashboard using Contour with TLS certificates.

Step 1. Download the Kubernetes Dashboard manifest

https://raw.githubusercontent.com/kubernetes/dashboard/v2.7.0/aio/deploy/recommended.yaml

Step 2. Edit the file

Go to the kubernetes-dashboard Service and add in another line to make the service a ClusterIP service for Contour to use. It should look like this:

kind: Service
apiVersion: v1
metadata:
  labels:
    k8s-app: kubernetes-dashboard
  name: kubernetes-dashboard
  namespace: kubernetes-dashboard
spec:
  ports:
    - port: 443
      targetPort: 8443
  selector:
    k8s-app: kubernetes-dashboard
  type: ClusterIP

Go to the kubernetes-dashboard-certs Secret and add in your tls certificate and private key for the Dashboard in base64 format and change the type to kubernetes.io/tls. It should look something like this:

apiVersion: v1
kind: Secret
metadata:
  labels:
    k8s-app: kubernetes-dashboard
  name: kubernetes-dashboard-certs
  namespace: kubernetes-dashboard
data:
  tls.crt: LS0tLS1CRUdJTiBDRVJUSUZJQ0FURS0tLS0tCk1JSUU1VENDQTgyZ0F3SUJBZ0lT--snipped--
  tls.key: --snipped--
type: kubernetes.io/tls

Go to the kubernetes-dashboard Deployment spec.template.spec.containers.args section and add in these two lines:

            - --tls-cert-file=/tls.crt
            - --tls-key-file=/tls.key

It should end up looking something like this:

    spec:
      securityContext:
        seccompProfile:
          type: RuntimeDefault
      containers:
        - name: kubernetes-dashboard
          image: kubernetesui/dashboard:v2.7.0
          imagePullPolicy: Always
          ports:
            - containerPort: 8443
              protocol: TCP
          args:
            - --tls-cert-file=/tls.crt
            - --tls-key-file=/tls.key
            - --auto-generate-certificates
            - --namespace=kubernetes-dashboard

Step 3. Add in the Contour httpproxy

Go all the way to the bottom of the file and add in this section, of course changing it to your desired FQDN.

---

apiVersion: projectcontour.io/v1
kind: HTTPProxy
metadata:
  labels:
    k8s-app: kubernetes-dashboard
  namespace: kubernetes-dashboard
  name: kubernetes-dashboard-httpproxy
spec:
  routes:
  - conditions:
    - prefix: /
    services:
    - name: kubernetes-dashboard
      port: 443
      protocol: tls
  virtualhost:
    fqdn: kubernetes-dashboard.vmwire.com
    tls:
      secretName: kubernetes-dashboard-certs

Step 4. Add in a ServiceAccount and a ClusterRoleBinding

Go all the way to the bottom of the file and add in this section.

---
apiVersion: v1
kind: ServiceAccount
metadata:
  name: admin-user
  namespace: kubernetes-dashboard
---
apiVersion: rbac.authorization.k8s.io/v1
kind: ClusterRoleBinding
metadata:
  name: admin-user
roleRef:
  apiGroup: rbac.authorization.k8s.io
  kind: ClusterRole
  name: cluster-admin
subjects:
- kind: ServiceAccount
  name: admin-user

Step 5. Deploy the manifest

kubetcl apply -f recommended.yaml

Step 6. Obtain login token

kubectl -n kubernetes-dashboard create token admin-user
Using Contour to expose Grafana and Prometheus with TLS

The Tanzu Packages in Tanzu Kubernetes Grid (TKG) include Contour, Grafana and Prometheus. Tanzu Packages automatically install and create TLS if ingress is enabled. This post, shows how to update the prometheus-data-values.yaml and grafana-data-values.yaml files to use TLS certificates with ingress using Contour.

This post can be used for TKG on vSphere and CSE with VCD. The examples below use TKG with CSE 4.0.3.

Install Contour

List available contour packages

tanzu package available list contour.tanzu.vmware.com -A

We shall install the latest version available for TKG 1.6.1 used by CSE 4.0.3, 1.20.2+vmware.2-tkg.1. First we need a contour-data-values.yaml file to use to install contour.

If you want to use a static IP address for the envoy load balancer service, for example to re-use the external public IP address currently used by the Kube API you can add a line under line 12:

LoadBalancerIP: <external-ip>

---
infrastructure_provider: vsphere
namespace: tanzu-system-ingress
contour:
 configFileContents: {}
 useProxyProtocol: false
 replicas: 2
 pspNames: "vmware-system-restricted"
 logLevel: info
envoy:
 service:
   type: LoadBalancer
   annotations: {}
   labels: {}
   nodePorts:
     http: null
     https: null
   externalTrafficPolicy: Cluster
   disableWait: false
 hostPorts:
   enable: true
   http: 80
   https: 443
 hostNetwork: false
 terminationGracePeriodSeconds: 300
 logLevel: info
 pspNames: null
certificates:
 duration: 8760h
 renewBefore: 360h

Then install with this command

kubectl create ns my-packages
tanzu package install contour \
--package contour.tanzu.vmware.com \
--version 1.20.2+vmware.2-tkg.1 \
--values-file /home/contour/contour-data-values.yaml \
--namespace my-packages

Install Prometheus

tanzu package available list prometheus.tanzu.vmware.com -A

The latest available version for TKG 1.6.1 used by CSE 4.0.3 is 2.36.2+vmware.1-tkg.1.

Update your prometheus-data-values.yaml file with the TLS certificate, private key, enable ingress and update the virtual_host_fqdn. Use pipe “|” to include all lines of your certificate.

ingress:
  annotations:
    service.beta.kubernetes.io/vcloud-avi-ssl-no-termination: "true"
  alertmanager_prefix: /alertmanager/
  alertmanagerServicePort: 80
  enabled: true
  prometheus_prefix: /
  prometheusServicePort: 80
  tlsCertificate:
    tls.crt: |
      -----BEGIN CERTIFICATE-----
      MIIEZDCCA0ygAwIBAgISA1UHbwcEhpImsiCGFwSMTVQsMA0GCSqGSIb3DQEBCwUA
      MDIxCzAJBgNVBAYTAlVTMRYwFAYDVQQKEw1MZXQncyBFbmNyeXB0MQswCQYDVQQD
      -- snipped --
      -----END CERTIFICATE-----
    tls.key: |

    ca.crt:
  virtual_host_fqdn: prometheus.tenant1.vmwire.com

Install Prometheus with this command

tanzu package install prometheus \
--package prometheus.tanzu.vmware.com \
--version 2.36.2+vmware.1-tkg.1 \
--values-file prometheus-data-values.yaml \
--namespace my-packages

Install Grafana

List available Grafana packages

tanzu package available list grafana.tanzu.vmware.com -A

The latest available version for TKG 1.6.1 used by CSE 4.0.3 is 7.5.7+vmware.2-tkg.1.

Update your grafana-data-values.yaml file with the TLS certificate, private key, enable ingress and update the virtual_host_fqdn. Use pipe “|” to include all lines of your certificate.

ingress:
  annotations:
    service.beta.kubernetes.io/vcloud-avi-ssl-no-termination: "true"
  enabled: true
  prefix: /
  servicePort: 80
  virtual_host_fqdn: grafana.tenant1.vmwire.com
  tlsCertificate:
    tls.crt: |
      -----BEGIN CERTIFICATE-----
      MIIEZDCCA0ygAwIBAgISA1UHbwcEhpImsiCGFwSMTVQsMA0GCSqGSIb3DQEBCwUA
      MDIxCzAJBgNVBAYTAlVTMRYwFAYDVQQKEw1MZXQncyBFbmNyeXB0MQswCQYDVQQD
      --snipped--
      -----END CERTIFICATE-----
    tls.key: |
      -----BEGIN PRIVATE KEY-----
      
      -----END PRIVATE KEY-----

Install Grafana with this command

tanzu package install grafana \
--package grafana.tanzu.vmware.com \
--version 7.5.7+vmware.2-tkg.1 \
--values-file grafana-data-values.yaml \
--namespace my-packages

Update DNS records

Update DNS records for the FQDNs to point to the IP address of the envoy service. You can find the External IP address used by Envoy by typing

k get svc -n tanzu-system-ingress envoy.

Using Contour for KubeApps with TLS

Kubeapps provides a cloud native solution to browse, deploy and manage the lifecycle of applications on a Kubernetes cluster. The very basic installation of KubeApps does not expose the application outside of the Kubernetes cluster as the default service type is ClusterIP.

You can easily expose using a LoadBalancer service but the application will use a self-signed certificate.

This post shows you how you can expose using Contour ingress instead and use a TLS certificate to secure access.

Deploy KubeApps

You’ll need to have Contour installed before installing KubeApps.

Deploy KubeApps as normal using Helm.

helm repo add bitnami https://charts.bitnami.com/bitnami
kubectl create namespace kubeapps
helm install kubeapps --namespace kubeapps bitnami/kubeapps

Create a demo credential to access KubeApps

kubectl create --namespace default serviceaccount kubeapps-operator
kubectl create clusterrolebinding kubeapps-operator --clusterrole=cluster-admin --serviceaccount=default:kubeapps-operator
cat <<EOF | kubectl apply -f -
apiVersion: v1
kind: Secret
metadata:
  name: kubeapps-operator-token
  namespace: default
  annotations:
    kubernetes.io/service-account.name: kubeapps-operator
type: kubernetes.io/service-account-token
EOF


Create Contour HTTPProxy and Kubernetes-tls secret

Use this manifest to create a kubernetes-tls secret and httpproxy to use with Contour.

Paste in the tls.crt and tls.key in base64 format and update the fqdn.

kubeapps-contour.yaml

apiVersion: projectcontour.io/v1
kind: HTTPProxy
metadata:
  name: kubeapps-grpc
  namespace: kubeapps
spec:
  virtualhost:
    fqdn: kubeapps.tenant1.vmwire.com
    tls:
      secretName: kubeapps-host-tls
  routes:
    - conditions:
      - prefix: /apis/
      pathRewritePolicy:
        replacePrefix:
        - replacement: /
      services:
        - name: kubeapps-internal-kubeappsapis
          port: 8080
          protocol: h2c
    - services:
      - name: kubeapps
        port: 80
---
apiVersion: v1
data:
  tls.crt: |
    ---snipped---
  tls.key: |

kind: Secret
metadata:
  name: kubeapps-host-tls
  namespace: kubeapps
type: kubernetes.io/tls

Then apply the manifest to create the secret and httpproxy with kubectl apply -f kubeapps-contour.yaml.

Update DNS

Update DNS records for the FQDNs to point to the IP address of the envoy service. You can find the External IP address used by Envoy by typing kubectl get svc -n tanzu-system-ingress envoy.

Obtain token and login

Obtain the token to login kubectl get --namespace default secret kubeapps-operator-token -o go-template='{{.data.token | base64decode}}'

Open up a browser session and enter the FQDN of the virtual host. You should now be able to log into KubeApps and enjoy a secure TLS connection too.

Quick guide to install cert-manager, contour, prometheus and grafana into TKG using Tanzu Packages (Kapp)

Intro

For an overview of Kapp, please see this link here.

The latest versions as of TKG 1.5.1, February 2022.

PackageVersion
cert-manager1.5.3+vmware.2-tkg.1
contour1.18.2+vmware.1-tkg.1
prometheus2.27.0+vmware.2-tkg.1
grafana7.5.7+vmware.2-tkg.1

Or run the following to see the latest available versions.

tanzu package available list cert-manager.tanzu.vmware.com -A
tanzu package available list contour.tanzu.vmware.com -A
tanzu package available list prometheus.tanzu.vmware.com -A
tanzu package available list grafana.tanzu.vmware.com -A

Install Cert Manager

tanzu package install cert-manager \
--package-name cert-manager.tanzu.vmware.com \
--namespace my-packages \
--version 1.5.3+vmware.2-tkg.1 \
--create-namespace

I’m using ingress with Contour which needs a load balancer to expose the ingress services. Install AKO and NSX Advanced Load Balancer (Avi) by following this previous post.

Install Contour

Create a file named contour-data-values.yaml, this example uses NSX Advanced Load Balancer (Avi)

---
infrastructure_provider: vsphere
namespace: tanzu-system-ingress
contour:
 configFileContents: {}
 useProxyProtocol: false
 replicas: 2
 pspNames: "vmware-system-restricted"
 logLevel: info
envoy:
 service:
   type: LoadBalancer
   annotations: {}
   nodePorts:
     http: null
     https: null
   externalTrafficPolicy: Cluster
   disableWait: false
 hostPorts:
   enable: true
   http: 80
   https: 443
 hostNetwork: false
 terminationGracePeriodSeconds: 300
 logLevel: info
 pspNames: null
certificates:
 duration: 8760h
 renewBefore: 360h

Remove comments in the contour-data-values.yaml file.

yq -i eval '... comments=""' contour-data-values.yaml

Deploy contour

tanzu package install contour \
--package-name contour.tanzu.vmware.com \
--version 1.18.2+vmware.1-tkg.1 \
--values-file contour-data-values.yaml \
--namespace my-packages

Install Prometheus

Download the prometheus-data-values.yaml file to use custom values to use ingress.

image_url=$(kubectl -n tanzu-package-repo-global get packages prometheus.tanzu.vmware.com.2.27.0+vmware.2-tkg.1 -o jsonpath='{.spec.template.spec.fetch[0].imgpkgBundle.image}')

imgpkg pull -b $image_url -o /tmp/prometheus-package-2.27.0+vmware.2-tkg.1

cp /tmp/prometheus-package-2.27.0+vmware.2-tkg.1/config/values.yaml prometheus-data-values.yaml

Edit the file and change any settings you need such as adding the TLS certificate and private key for ingress. It’ll look something like this.

ingress:
  enabled: true
  virtual_host_fqdn: "prometheus-tkg-mgmt.vmwire.com"
  prometheus_prefix: "/"
  alertmanager_prefix: "/alertmanager/"
  prometheusServicePort: 80
  alertmanagerServicePort: 80
  tlsCertificate:
    tls.crt: |
      -----BEGIN CERTIFICATE-----
      --- snipped---
      -----END CERTIFICATE-----
    tls.key: |
      -----BEGIN PRIVATE KEY-----
      --- snipped---
      -----END PRIVATE KEY-----

Remove comments in the prometheus-data-values.yaml file.

yq -i eval '... comments=""' prometheus-data-values.yaml

Deploy prometheus

tanzu package install prometheus \
--package-name prometheus.tanzu.vmware.com \
--version 2.27.0+vmware.2-tkg.1 \
--values-file prometheus-data-values.yaml \
--namespace my-packages

Install Grafana

Download the grafana-data-values.yaml file.

image_url=$(kubectl -n tanzu-package-repo-global get packages grafana.tanzu.vmware.com.7.5.7+vmware.2-tkg.1 -o jsonpath='{.spec.template.spec.fetch[0].imgpkgBundle.image}')

imgpkg pull -b $image_url -o /tmp/grafana-package-7.5.7+vmware.2-tkg.1

cp /tmp/grafana-package-7.5.7+vmware.2-tkg.1/config/values.yaml grafana-data-values.yaml

Generate a Base64 password and edit the grafana-data-values.yaml file to update the default admin password.

echo -n 'Vmware1!' | base64

Also update the TLS configuration to use signed certificates for ingress. It will look something like this.

  secret:
    type: "Opaque"
    admin_user: "YWRtaW4="
    admin_password: "Vm13YXJlMSE="

ingress:
  enabled: true
  virtual_host_fqdn: "grafana-tkg-mgmt.vmwire.com"
  prefix: "/"
  servicePort: 80
  #! [Optional] The certificate for the ingress if you want to use your own TLS certificate.
  #! We will issue the certificate by cert-manager when it's empty.
  tlsCertificate:
    #! [Required] the certificate
    tls.crt: |
      -----BEGIN CERTIFICATE-----
      ---snipped---
      -----END CERTIFICATE-----
    #! [Required] the private key
    tls.key: |
      -----BEGIN PRIVATE KEY-----
      ---snipped---
      -----END PRIVATE KEY-----

Since I’m using ingress to expose the Grafana service, also change line 33, from LoadBalancer to ClusterIP. This prevents Kapp from creating an unnecessary service that will consume an IP address.

#! Grafana service configuration
   service:
     type: ClusterIP
     port: 80
     targetPort: 3000
     labels: {}
     annotations: {}

Remove comments in the grafana-data-values.yaml file.

yq -i eval '... comments=""' grafana-data-values.yaml

Deploy Grafana

tanzu package install grafana \
--package-name grafana.tanzu.vmware.com \
--version 7.5.7+vmware.2-tkg.1 \
--values-file grafana-data-values.yaml \
--namespace my-packages

Accessing Grafana

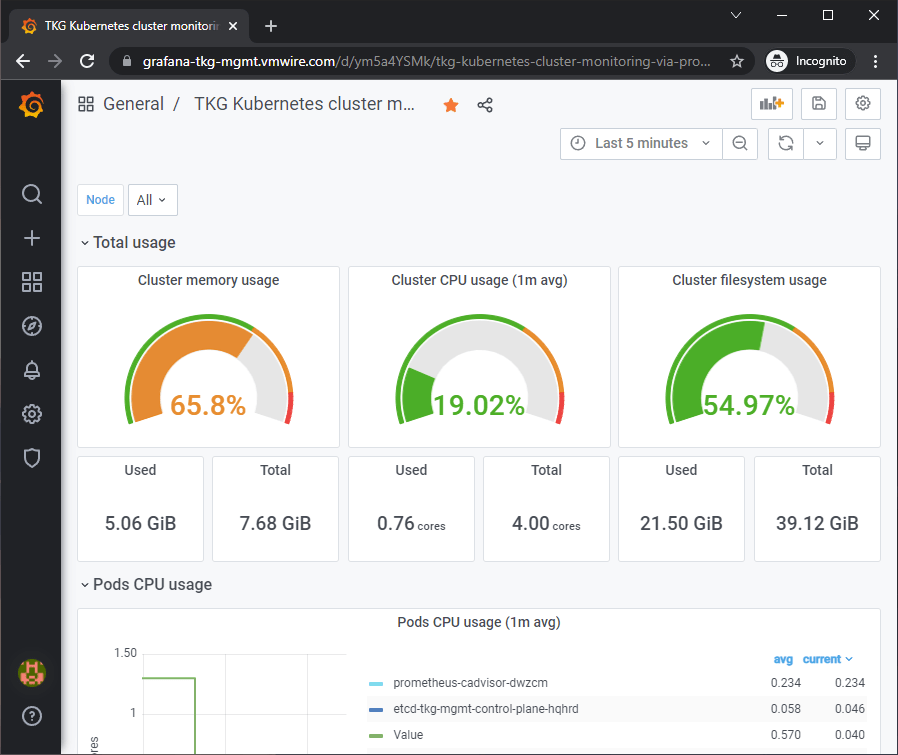
Since I’m using ingress and I set the ingress FQDN as grafana-tkg-mgmt.vmwire.com and I also used TLS. I can now access the Grafana UI using https://grafana-tkg-mgmt.vmwire.com and enjoy a secure connection.

Listing all installed packages

tanzu package installed list -A

Making changes to Contour, Prometheus or Grafana

If you need to make changes to any of the configuration files, you can then update the deployment with the tanzu package installed update command.

tanzu package installed update contour \
--version 1.18.2+vmware.1-tkg.1 \
--values-file contour-data-values.yaml \
--namespace my-packages
tanzu package installed update prometheus \
--version 2.27.0+vmware.2-tkg.1 \
--values-file prometheus-data-values.yaml \
--namespace my-packages
tanzu package installed update grafana \
--version 7.5.7+vmware.2-tkg.1 \
--values-file grafana-data-values.yaml \
--namespace my-packages

Removing Cert Manager, Contour, Prometheus or Grafana

tanzu package installed delete cert-manager -n my-packages
tanzu package installed delete contour -n my-packages
tanzu package installed delete prometheus -n my-packages
tanzu package installed delete grafana -n my-packages

Copypasta for doing this again on another cluster

Place all your completed data-values files into a directory and just run the entire code block below to set everything up in one go.

# Deploy cert-manager
tanzu package install cert-manager \
--package-name cert-manager.tanzu.vmware.com \
--namespace my-packages \
--version 1.5.3+vmware.2-tkg.1 \
--create-namespace

# Deploy contour
yq -i eval '... comments=""' contour-data-values.yaml
tanzu package install contour \
--package-name contour.tanzu.vmware.com \
--version 1.18.2+vmware.1-tkg.1 \
--values-file contour-data-values.yaml \
--namespace my-packages

# Deploy prometheus
yq -i eval '... comments=""' prometheus-data-values.yaml
tanzu package install prometheus \
--package-name prometheus.tanzu.vmware.com \
--version 2.27.0+vmware.2-tkg.1 \
--values-file prometheus-data-values.yaml \
--namespace my-packages

# Deploy grafana
yq -i eval '... comments=""' grafana-data-values.yaml
tanzu package install grafana \
--package-name grafana.tanzu.vmware.com \
--version 7.5.7+vmware.2-tkg.1 \
--values-file grafana-data-values.yaml \
--namespace my-packages